 See why 4thWay now accepts ethical ads.
Update On Crowd2Fund’s Performance
IFISA and peer-to-peer lending website Crowd2Fund, which offers business lending, has this month started publishing a bit more information about how its loans have performed in the three years or so that it has been matching borrowers and lenders together. So I'm taking a look at this information to see what it can already reveal to us about the risks and rewards at Crowd2Fund.
It's going to be a very basic assessment. My main purpose is educational, showing you a little bit how to begin to interpret figures given to you by peer-to-peer lending sites and read between the lines, using some of the more simple concepts and knowledge that the investing, banking and risk experts here at 4thWay have shared with me.
You can see most of the information that Crowd2Fund* is now providing for yourself on its new fund statistics page, which is the page I'm referring to for this article. I'm told the figures on that page are correct up to 31 March 2018 and Crowd2Fund's intention is to update them on a monthly basis.
Now, I'm going to pull out the key statistics from that page to pick at:
Average interest that lenders have earned before fees and bad debts is 9.84%
That interest rate is before deducting any fees, bad debt or late payments, meaning the actual rate received will have been lower than that.
This interest rate is roughly consistent with the rates you might normally expect for lending to creditworthy unsecured business borrowers spread across several super-prime to prime borrower grades, which are the types of borrowers that Crowd2Fund is seeking to select on lenders' behalf.
That said, you can't know the risk of loans from the interest rate. (Just look at Wellesley & Co.*, which was paying barely more than 1% on property bridging and development loans at one point.) So look to other facts and figures provided by Crowd2Fund to assess the risks. Some of those are coming up below.
£17.12 million in loans have been made
This total lending amount shows that Crowd2Fund is still a cute little tiddler, compared to the billion in annual lending done at the largest peer-to-peer lending sites. That means there's less history to go on which inhibits any assessment of the risks. But in the P2P space small also typically means that you could find some really good bargains with high rates compared to the risks by looking at the individual loans.
According to my estimates from data acquired from another source, £17 million in lending today means that Crowd2Fund might have roughly tripled or quadrupled its loan book in about a year.
That speed of growth is absolutely acceptable at this scale. A much larger P2P lending site still growing at that speed could be a concern, since it would indicate it has started to approve loans willy-nilly.
Just a quick side note that it is still cashback season in P2P lending, so Crowd2Fund has added its own deal, offering an attractive 2% cashback if you move fast enough (but do take the time to be comfortable you understand the risks before lending your money anywhere). You can read about its cashback deal in our updated guide here: P2P Lending And IFISA Cashback Deals Available Now.
Interest earned by lenders: £896,410
Seeing the pound amount probably makes it easier for lenders to visualise that real money is being earned, not just an interest rate, which could be why Crowd2Fund shows this amount on its stats page.
This figure helps us estimate that most loans must have gone live in the past 12 months, because £896k is only about 5% of the total loans that have ever been made.
252 loans have been made
There are 252 loans, so we can now calculate that the average loan is around £70,000.
This indicates there could be enough loans to select a large loan portfolio to spread your risk. Be aware that Crowd2Fund does different types of loans, from bog-standard loans to potentially riskier loans where you only earn and get repaid if the business makes enough money.
Loans in default: 0.57%
At this stage in Crowd2Fund's life, this number has little meaning by itself. I'll come to a more meaningful figure later.
However, just for your education, I'll explain that this figure means the proportion of loans, by the pound amount, that Crowd2Fund considers to be worse than just late and it is actively taking steps to recover. It excludes any amounts already recovered from bad debtors.
Using 0.57% and the total lent amount of £17.12 million, this means the amount Crowd2Fund classes as in default is £97,584.
Loans written off: 0%
Same again, in that this figure isn't meaningful yet, and I'll come to a better, simple but useful “getting started” way to measure the results for a P2P lending site in this stage of its life very shortly.
But, just so you know, “written off” loans here means the proportion of loans by pound amount that have gone bad, and that Crowd2Fund has tried to recover, but failed, and it has now called it quits.
Interest-rate graph
Next on Crowd2Fund's statistics page is its interest-rate graph, which looks like this:
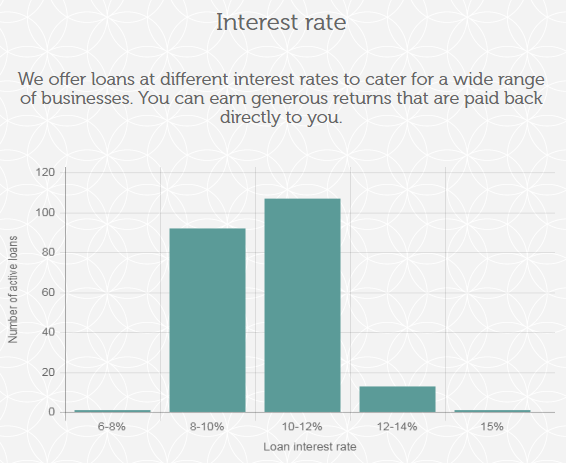
You can click to expand the graph above. It shows that, at the moment, few live loans have been matched in the 6% to 8% interest-rate range, or above 12%, before fees and bad debts, and that loans are highly concentrated in the 8% to 12% range.
This narrows the rates to fit in the range we'd generally expect for prime business borrowers, but perhaps not what we at 4thWay generally call “super-prime”, which is the prime of the prime.
Again, though, interest rates are not a measure of risk, but potential reward. It is quite common in smaller and newer peer-to-peer lending websites, for example, that lenders earn more interest than they deserve relative to the risks – provided the P2P lending site is good at choosing quality borrowers.
This imbalance in favour of lenders corrects itself as the P2P site grows and it can no longer be super selective of top-quality borrowers who also are relaxed about the interest rate they are charged.
Length-of-arrears graph
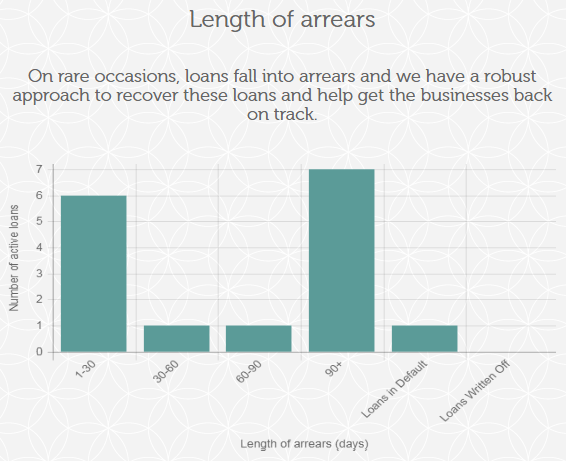
You may have noticed I've just skipped one graph from Crowd2Fund's Fund Statistics page and from this point on I'm going to be more selective of what I show you to keep to the more important points.
Now, with the above graph on arrears, it starts to get interesting for me. Add up all the loans in arrears (where borrowers are late to make payments) as well as the one loan that Crowd2Fund currently classes in default, and it comes to 16.
The first step here in doing the most basic risk calculation is to calculate that 16/252 loans are either late or are known to have gone bad, which is 6.35%. We combine the two to be cautious in our assessment of the loans potentially in trouble.
One striking factor that beginners fail to understand when lending is that a bad rate of 6.35% is not 6.35% per year.
Instead, the 6.35% figure reflects one-off bad debts that won't occur on the same loans again. On the other hand, the interest you earn is paid on the same loans every month, usually for years, which is especially useful if you are re-lending any repayments and interest you receive.
Unfortunately, we do not know how many loans have gone bad and been fully recovered. For estimating the risks, that would be useful and basic information for 4thWay's professional bank risk specialists. And we don't know how many of the bad or late debts are on the older loans, which would allow better assessment of bad debts to come.
To compare Crowd2Fund's figures elsewhere, using like-for-like figures, I took an old sample from Funding Circle's detailed loan data when it was in its younger days. Looking at Funding Circle's loans that were at least 30 days late or that had gone bad and not been recovered, I found that the rate of lates and bad debt was 2.52%, which is less than half the 6.35% rate at Crowd2Fund. That's a massive difference.
And yet Crowd2Fund has some unfortunate factors against it that are out of its control. Back then, Funding Circle's environment for lending was better, with lower bad debts nationwide and more businesses able to pay their debts.
In addition, even back then, Funding Circle was far larger, by multiples of ten. This means that random luck probably had little impact on Funding Circle's results, but a surprise batch of borrowers in Crowd2Fund's smaller book of loans could seriously impact Crowd2Fund's initial performance – either positively or negatively.
So, to make progress on assessing the risks against bad debts, let's leave the comparison and return to simply asking “What is a reasonable rate of lates and bad debts for a P2P lending site like Crowd2Fund right now?”
When banks do unsecured business lending, it is quite normal that around 6% of loans go bad. And Crowd2Fund has around 6% of bad and late loans.
Some of those late loans might get back on track, as they have done before at Crowd2Fund. To balance that out, some of the existing loans currently in good standing will fall late over the coming years and some of them will go bad. Bear in mind that the vast majority of Crowd2Fund's loans have probably gone live within the past year and bad debts in business lending tend to peak within three years, so it's early days for most of the active loans.
My best guess, based on the information available and the limited history, is the overall bad-debt figure will rise further, but lenders will still on average make a decent profit at these interest rates. Yet I'd like Crowd2Fund to start sharing detailed data so that we can dig much deeper.
Percentage of loans in arrears
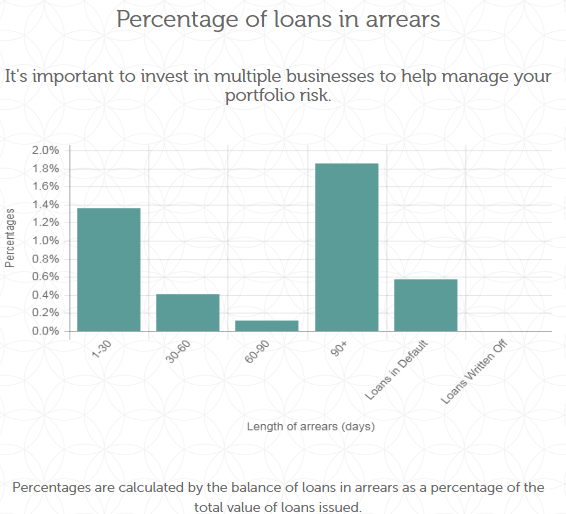
This is less useful than the previous graph.
Since it relies on the size of the outstanding loans (by pound amount) rather than the number of loans that have gone late, just a few larger or smaller loans can skew the results. At least, that is the case while Crowd2Fund is still small.
Portfolio-diversification graph
I'm going to skip now right to the last graph on the page, since everything in between isn't meaningful (at least not yet):
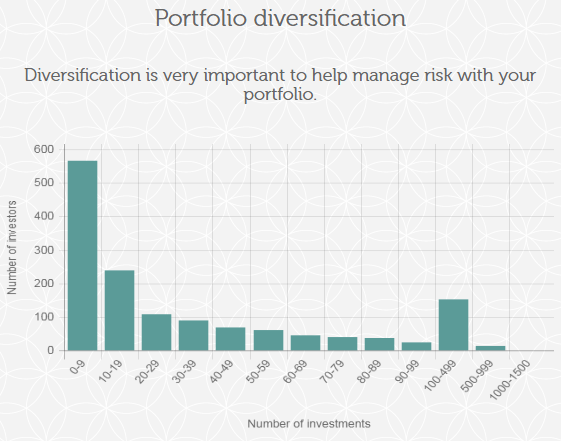
Some lenders are lending across 500 or more “investments”. That's an anomaly.
There are just 252 loans, so Crowd2Fund is probably counting each time a lender buys a different part of the same loan at different times, and also counting twice if a lender lends in two different loans to the same borrower.
That point aside, the largest section of lenders are lending in nine or fewer investments. This is perfectly acceptable only provided you are also lending a larger proportion of your money through other P2P lending sites or diversifying your money across other kinds of investments to get a good spread of risk and reward. If you aren't, you're taking huge risks. When lending in just a handful of loans, a little bit of bad luck on one or two loans could wipe out all the interest you will earn for many years to come.
Visit Crowd2Fund* to open an account.
Read the 4thWay Crowd2Fund Quick Expert Review.
Independent opinion: 4thWay will help you to identify your options and narrow down your choices. We suggest what you could do, but we won't tell you what to do or where to lend; the decision is yours. We are responsible for the accuracy and quality of the information we provide, but not for any decision you make based on it. The material is for general information and education purposes only.
We are not financial, legal or tax advisors, which means that we don't offer advice or recommendations based on your circumstances and goals.
The opinions expressed are those of the author(s) and not held by 4thWay. 4thWay is not regulated by ESMA or the FCA. All the specialists and researchers who conduct research and write articles for 4thWay are subject to 4thWay's Editorial Code of Practice. For more, please see 4thWay's terms and conditions.
*Commission, fees and impartial research: our service is free to you. 4thWay shows dozens of P2P lending accounts in our accurate comparison tables and we add new ones as they make it through our listing process. We receive compensation from Crowd2Fund and Wellesley & Co., and other P2P lending companies not mentioned above either when you click through from our website and open accounts with them, or when you make an investment, or to cover the costs of conducting our calculated stress tests and ratings assessments. We vigorously ensure that this doesn't affect our editorial independence. Read How we earn money fairly with your help.